


Herbert Stein chaired the Council of Economic Advisers under Presidents Nixon and Ford. He is remembered mostly for one sentence: “If something cannot go on forever, it will stop.” It sounds like a joke. It is actually a discipline. Stein’s Law does not tell you when a trend ends. It only reminds you that a trend running against its own math eventually meets that math. This quarter put three of those trends on the table: the price of money, the source of corporate earnings, and the gap between what consumers spend and what they earn.
Those three trends, plus one opportunity, lead to a single conclusion. High-grade bonds now pay close to the 6.0% return most of our clients’ financial plans require. Stocks sit at record highs, carried by record profit margins, while the paychecks that fund consumer spending have stopped growing after inflation. When bonds pay what your plan needs, there is little reason to bet that plan on earnings staying spectacular. So we will be reviewing each account’s equity exposure relative to its overall plan and adding to intermediate high-grade bonds, where appropriate, with attention to taxes. This is rebalancing, not a call that stocks will fall. Here is the reasoning behind it.
First, money got more expensive
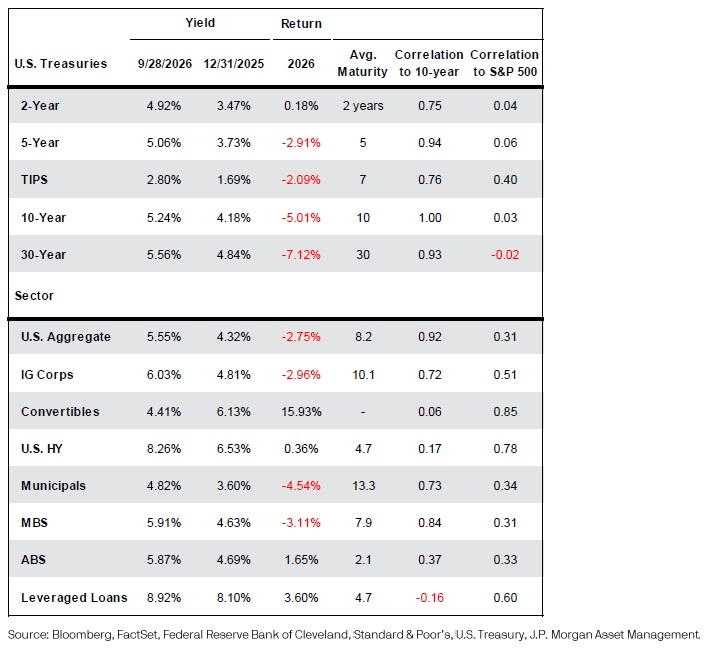
The change showed up quickly. Brent crude began the quarter at $72.92 a barrel and ended it at $103.53, a 42% climb (Bloomberg). The 10-year Treasury yield rose from 4.48% to 5.29% (Bloomberg). Single-A corporate bonds, measured by the ICE BofA Single-A index, went from 5.06% to 5.88% (ICE BofA). Mortgage rates have climbed to 7.28% (Freddie Mac). In three months, energy and borrowing both got meaningfully more expensive for governments, companies, and families alike. From December 31 through September 28, the 10-year yield climbed from 4.18% to 5.24%.
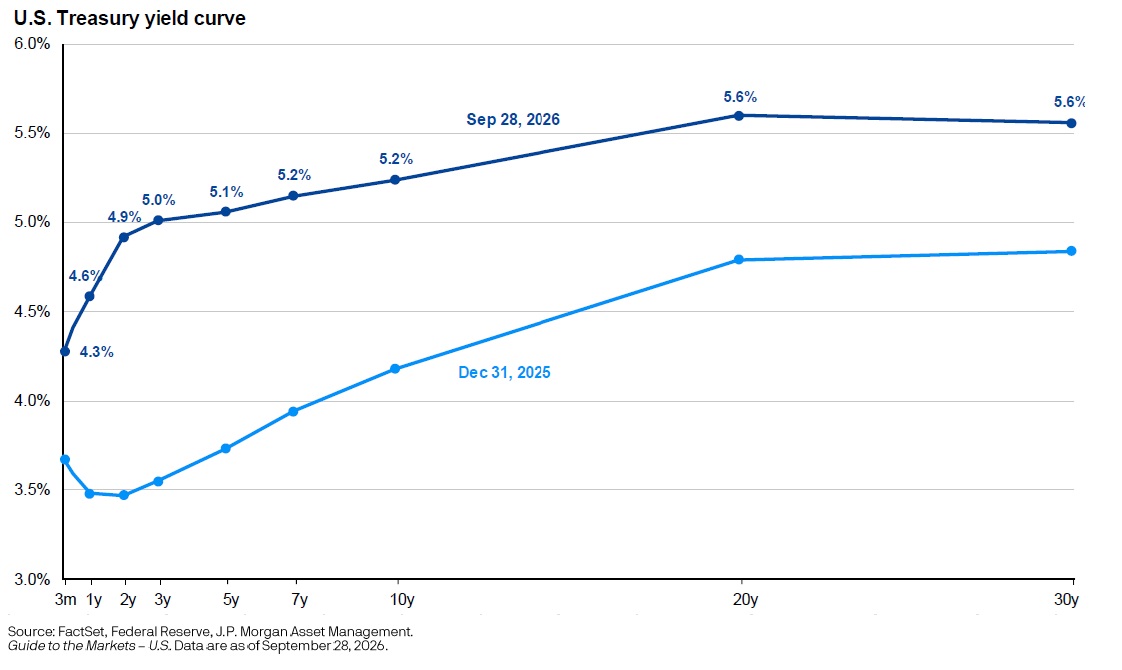
The 2-year yield moved even further, from 3.47% to 4.92%. When the short end of the curve moves that much, the message is about the Fed.
In December, markets expected the Fed to cut rates by about 0.59% during 2026.
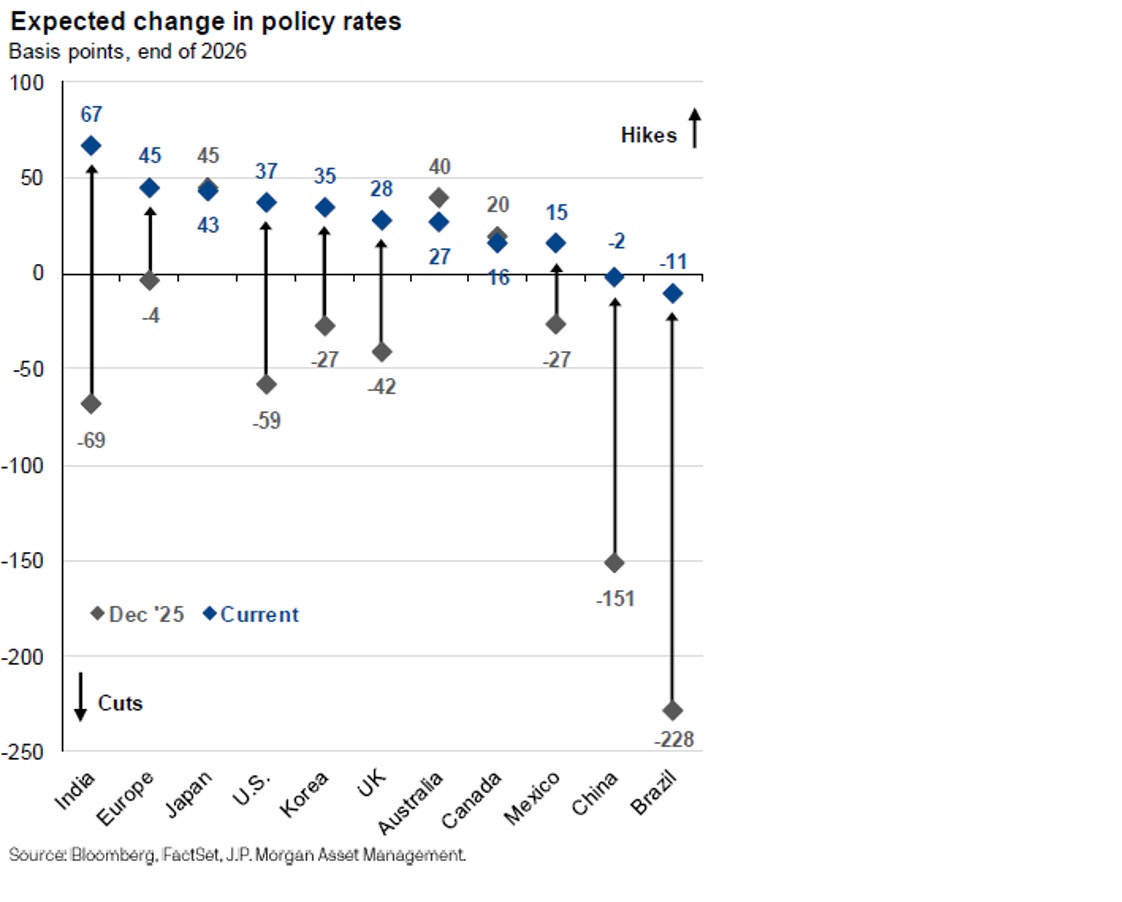
Today they expect about 0.37% of hikes. The Fed has already raised its policy rate to 3.88%. Futures now price 4.35% by year-end and 4.89% by the end of 2027. The Fed’s own projections are more restrained: 4.10% at year-end, then gradual cuts to 3.60% by 2029. The gap between what the market expects and what the Fed projects is itself a source of volatility.
The trigger was inflation, alongside a strong economy. Headline CPI rose from 2.3% in April 2025 to 3.4% in August.
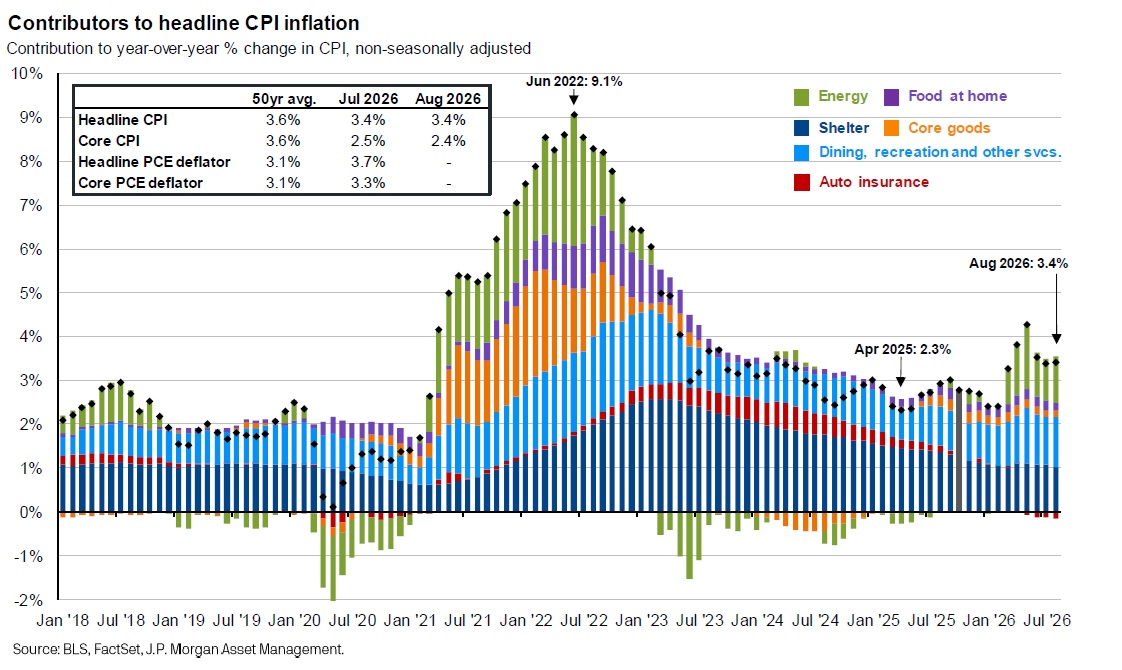
Energy did much of that work. The EIA expects OPEC output to fall from 29.3 million barrels a day in 2025 to 23.1 million in 2026. The measure the Fed actually targets tells the more important story. Core PCE inflation, which excludes food and energy, ran 3.3% in July, well above the Fed’s 2% goal. The Fed itself projects 3.4% by year-end. Oil lit the fire. It is not the only thing burning.
The repricing was global. Central banks in Europe, the UK, and India all swung from expected cuts to expected hikes this year.
What did not cause the move matters just as much. This was not a credit scare. Investment-grade spreads sit at 0.82%, tighter than 93% of their history since 2001, and the high-yield default rate is just 2.0%. It was not a recession scare. The U.S. composite PMI reached 58.4 in September, the strongest reading among major economies.
The shape of the yield curve adds one more clue. In December, the 10-year yielded 0.71% more than the 2-year. Today the gap is 0.32%. When short rates rise faster than long rates, the market expects the Fed to keep tightening into a strong economy. That kind of flattening has often come before growth slows, not after.
For the next one to three years, that means yields can stay elevated as long as growth stays solid and inflation stays above target. The drivers can also reverse. If oil settles and growth cools, inflation should follow, and the yields available today may look generous in hindsight.
Second, a dollar of earnings is worth less
My training as an analyst, first for the CFA charter and then managing fixed income for pension funds, came down to one question: compared to what? Every investment is valued relative to the least risky alternative. When the risk-free rate rises, everything carrying more risk has to reprice to stay competitive. Interest rates work on valuations the way gravity works on everything else.
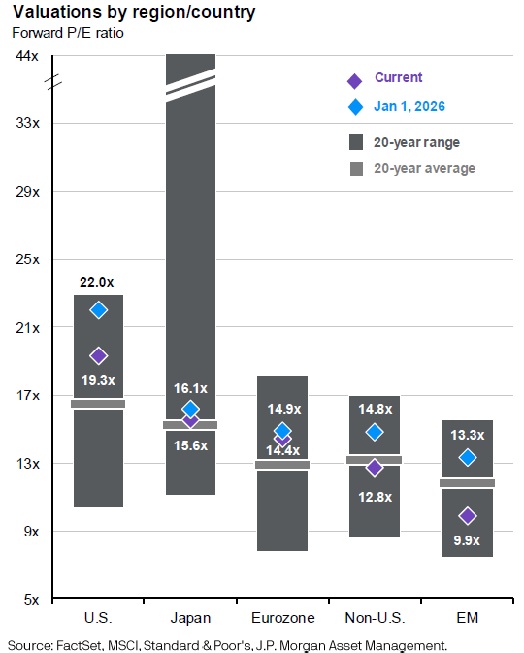
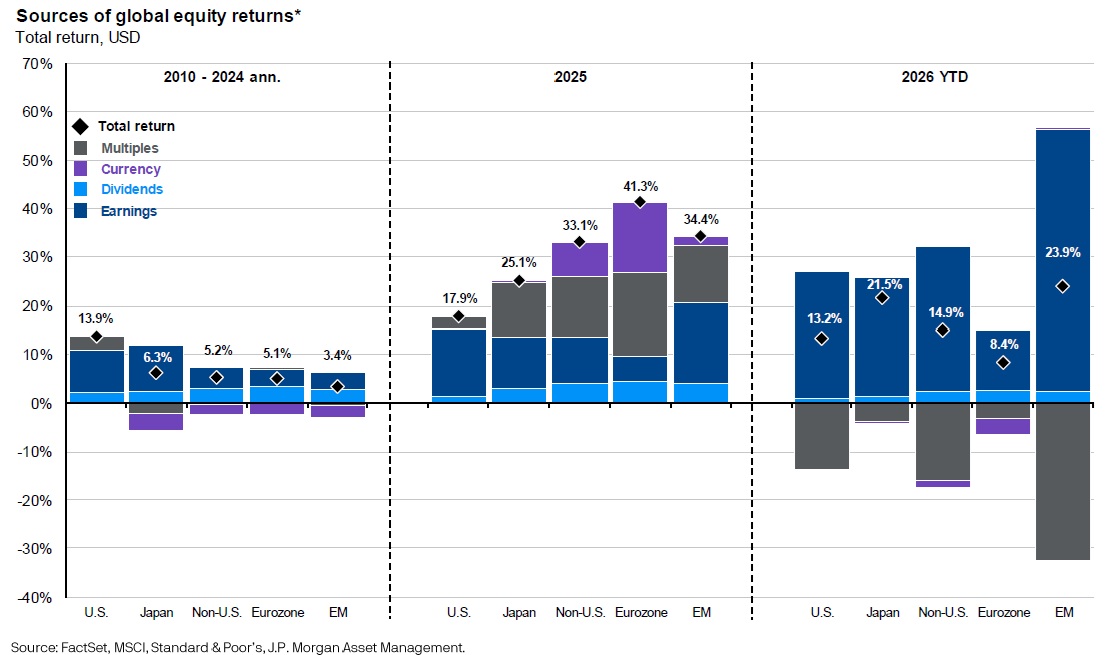
That is exactly what happened to stocks this year. The S&P 500 began 2026 at 22.0 times expected earnings for the next twelve months. On September 28 it traded at 19.3 times. The market is paying about 12% less for each dollar of future earnings. The comparison with bonds explains why. The S&P 500’s earnings yield, the inverse of its P/E, now sits 1.0% below the yield on Baa corporate bonds. Over the past 30 years it has averaged 0.7% above. Stocks still offer earnings growth that bonds cannot. But when a bond pays more than a stock earns, the stock has to promise a lot of growth to compete.
The compression was not just an American story. Since January 1, forward P/Es fell from 14.8 to 12.8 for non-U.S. stocks and from 13.3 to 9.9 for emerging markets. Overseas markets still posted strong gains, 14.9% for non-U.S. stocks and 23.9% for emerging markets in dollars. Those gains came from earnings, not from investors paying more. When valuations fall everywhere at once, the cause is global. Rates are the obvious suspect.
Yet the S&P 500 closed at a record 7,684 on September 28, its 27th all-time high of the year/ How does a shrinking multiple produce record prices? Earnings.
Third, spectacular earnings rest on record margins
S&P 500 earnings grew 13% in 2025. Consensus expects 31.6% growth in 2026, more than four times the 2001 to 2025 average of 7.6%. Over two years, that is roughly 50% more profit. Nothing short of spectacular.
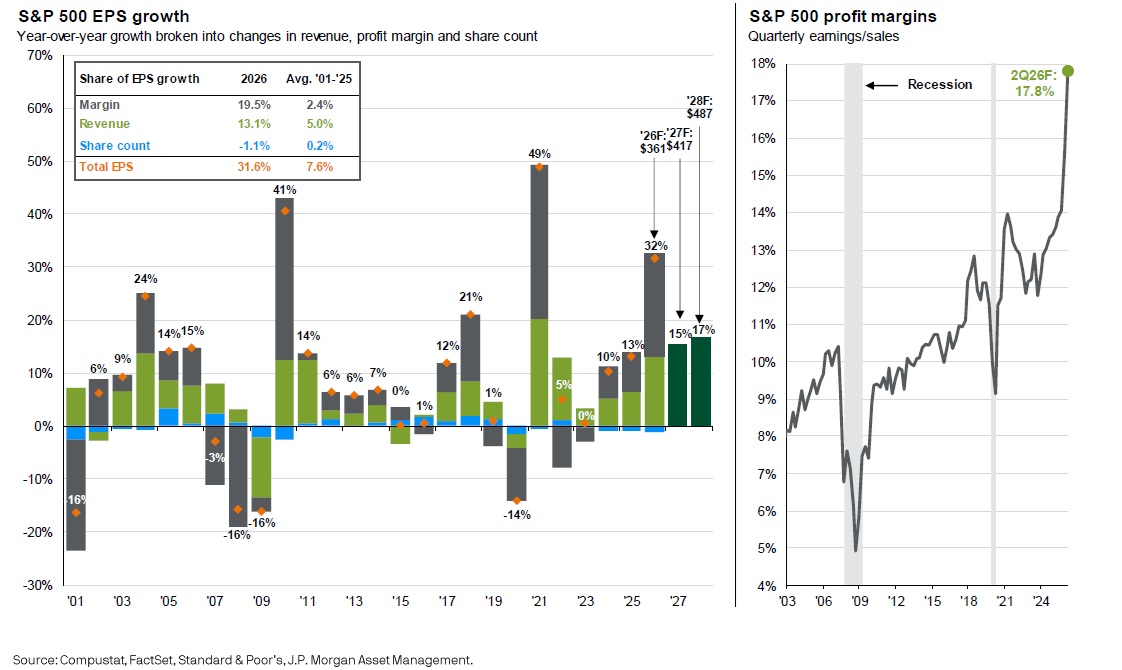
The source of that growth matters. Of this year’s 31.6%, 19.5 points come from wider profit margins, not higher sales. Margins are expected to reach a record 17.8%. Before 2020 they never cleared 13%. This year’s U.S. stock return breaks down simply. Earnings growth added roughly 26 points. Shrinking multiples took back roughly 14. Investors kept the difference.
Where did the margin come from? Partly from paychecks. Labor’s share of national income has fallen to about 60%, the lowest since at least 1970, while corporate profits have claimed their largest share over the same period. Keep that in mind. It returns in the next section.
Consensus already expects growth to slow to 15% in 2027 and 17% in 2028. Even those rates are double the long-run average. The real question is not whether growth slows from 32%. It is whether 15% is achievable when most of this year’s gain came from margins already at a record.
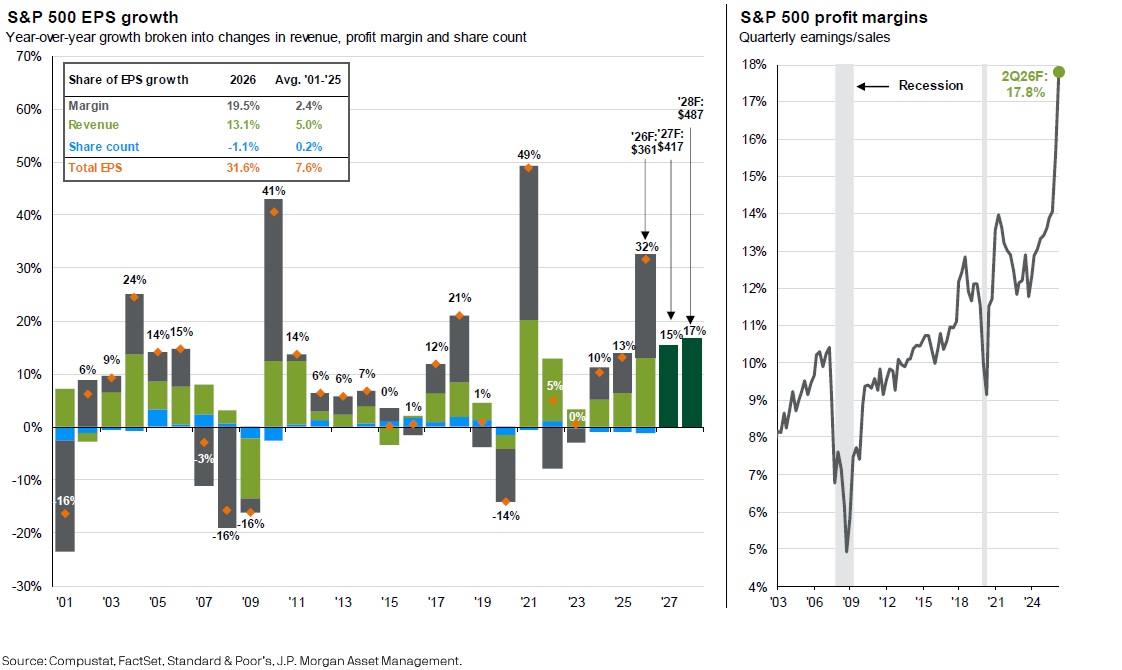
Markets rarely wait for a slowdown to appear in reported numbers. We saw this four years ago. On January 3, 2022, after earnings had grown 49% in 2021, the S&P 500 traded at 21.4 times earnings. By October, with 2022 earnings growth slowing to 5%, it traded at 15.7 times. There is a fair counterargument today: higher rates alone could explain the lower multiple. Both explanations point the same way. A future dollar of earnings is worth less today, and the bar for future earnings is higher.
Fourth, keep an eye on the paycheck
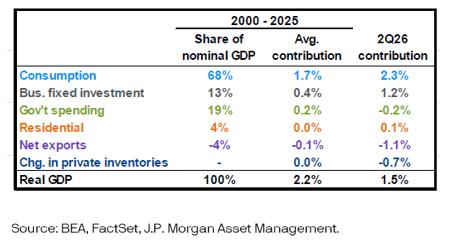
On the surface, the consumer looks fine. Consumer spending added 2.3 points to second-quarter GDP growth, more than its 1.7-point average since 2000.
The paycheck tells a different story. A year ago, hourly earnings for production and nonsupervisory workers were growing by 4.1%, while consumer prices, measured by the PCE price index, rose by 2.5%. Real pay was rising about 1.7%. By the second quarter of this year, earnings growth had slowed to 3.5%, inflation had climbed to 3.6%, and real pay had stalled (FRED). In August, wages grew 3.3% while the CPI rose 3.4%. Measured either way, the raise is gone.
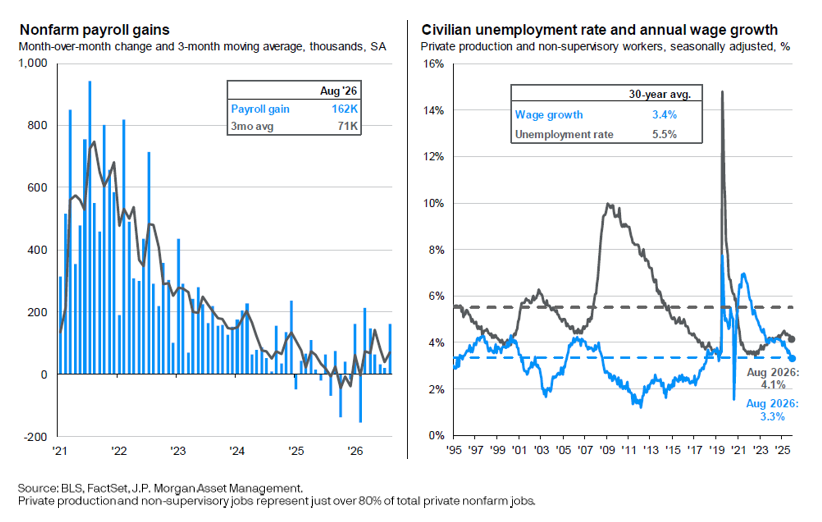
The total paycheck matters even more than hourly pay. Job growth has slowed to a three-month average of 71,000 a month. Fewer new jobs and flat real wages add up to a slowing paycheck for the economy as a whole.
Here is the mechanism. When spending exceeds income, the gap is filled by savings or credit. Both have limits. The share of credit card balances that are newly 30 or more days past due has reached 8.6%. The last time real pay went negative, in 2022, real spending growth slowed from 5.5% in the first quarter to 1.4% by the fourth (FRED). Reopening distortions exaggerated that episode, but the direction still holds.
Now connect it to earnings. The squeeze that lifted margins is the same squeeze weighing on paychecks. Neither trend can run forever, and each limits the other. Slower spending means slower revenue. Slower revenue hits record margins hardest, because they have the most room to fall.
It also reaches capital spending, by way of interest rates. The largest AI companies are expected to spend $799 billion on capital projects this year and $1.09 trillion next year, roughly all of their operating cash flow. Their free cash flow is projected to turn negative.
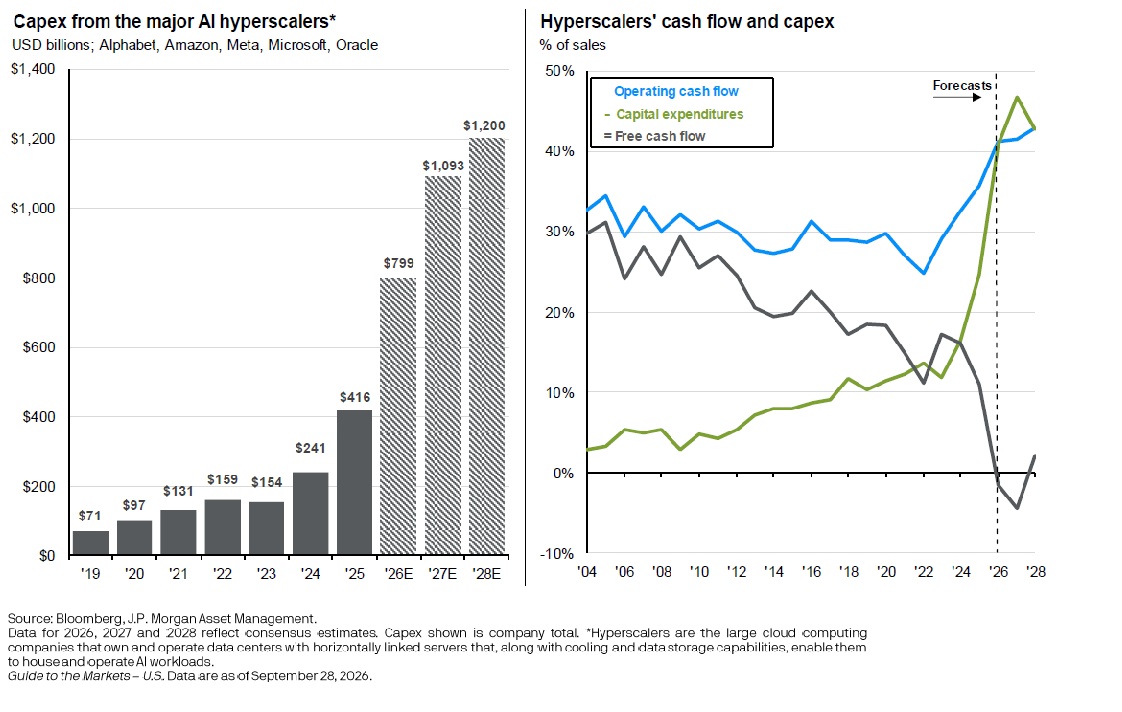
Companies in that position fund growth by borrowing, and investment-grade borrowing costs have risen from 4.81% to 6.03% this year. Business investment added 1.2 points to second-quarter GDP, three times its long-run average. Much of this year’s earnings boom flows from that spending.
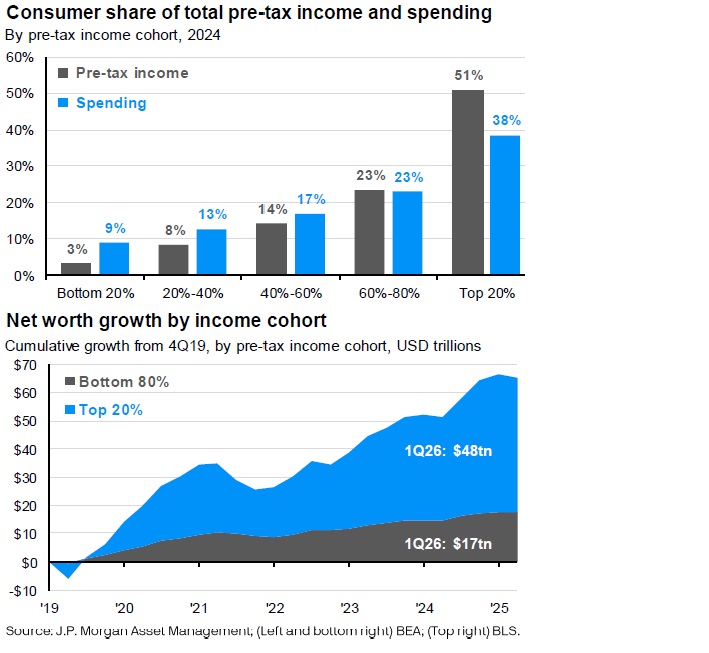
There is a real counterweight. The top 20% of earners account for 51% of income and 38% of spending, and their net worth has grown $48 trillion since 2019. As long as markets hold up, they can keep spending. That is precisely the point. More and more of the economy’s spending rests on asset prices staying high. Spending cannot outrun paychecks forever. Stein would recognize the pattern.
Fifth, bonds now pay what plans need
Single-A corporate bonds yield 5.88% and mortgage-backed securities 5.91%. Historically, the starting yield on the U.S. bond market has explained 89% of its return over the following five years. Today’s 5.55% implies about 5.7% a year. For taxable accounts, municipal bonds are the better comparison. They yield 4.82%, equivalent to about 8.1% before tax for an investor in the top bracket.
The risk profile is lopsided in your favor. If rates fall 1%, the U.S. bond market would return about 11.3% over a year. If rates rise another 1%, it would roughly break even, because the income cushions the price decline.
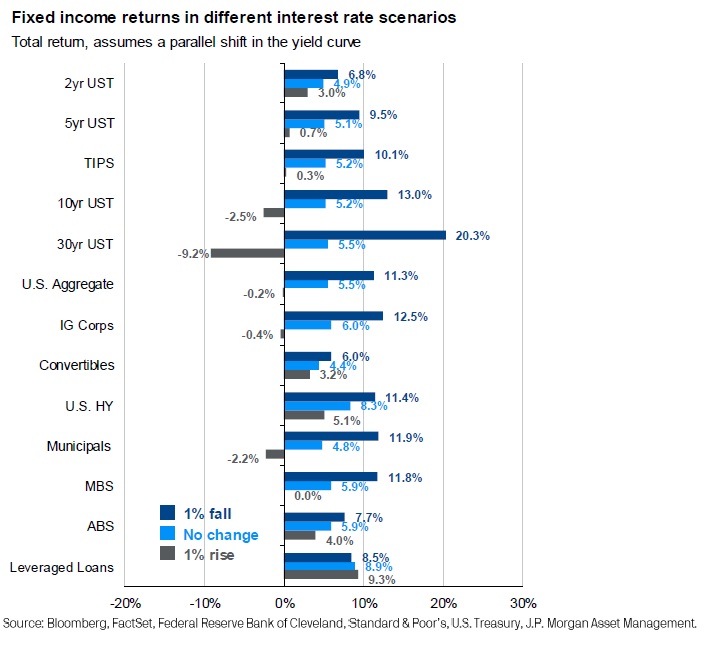
There is one caveat, and it is credit. Investment-grade spreads are tighter than 93% of their history. Most of a corporate bond’s yield today is Treasury yield, not pay for credit risk. If the slowdown we are watching arrives, spreads can widen. So we favor Treasuries and agency mortgage bonds and stay selective in corporates. Mortgage bonds carry their own trade-off: if rates fall, homeowners refinance, which caps the upside.
The flat curve raises a fair question. Why own longer bonds when the 2-year pays 4.92% and the 10-year only 5.24%? Because if growth slows and the Fed reverses, the 2-year’s yield disappears at the next reinvestment. The longer bond keeps paying and rises in price. That is the reason to lock in today’s yields.
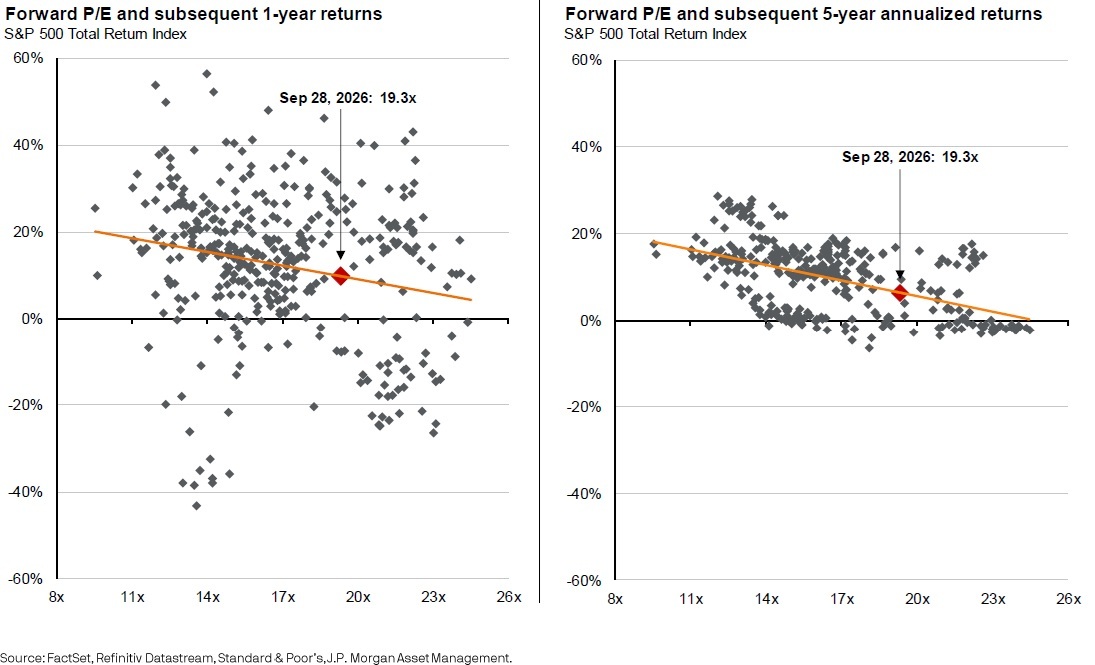
Compare all of that to stocks at 19.3 times earnings. That starting point has historically been followed by five-year returns in the mid single digits, with a wide range of outcomes in either direction. Similar expected return. Very different risk.
What this means for your accounts
Rebalancing also corrects something most investors never decided to do. A 60/40 portfolio left alone since 2019 is now 75% stocks and 25% bonds. Many investors took on more risk this cycle without noticing. Bringing allocations back to target fixes that, and today’s yields make it unusually rewarding.
Stocks remain the core of every growth-oriented plan we manage. Over long periods they have earned more than bonds, and earnings may keep surprising. Do we need to stick around with the whole portfolio to find out? Buy low, sell high only works if you actually sell some of what went high.
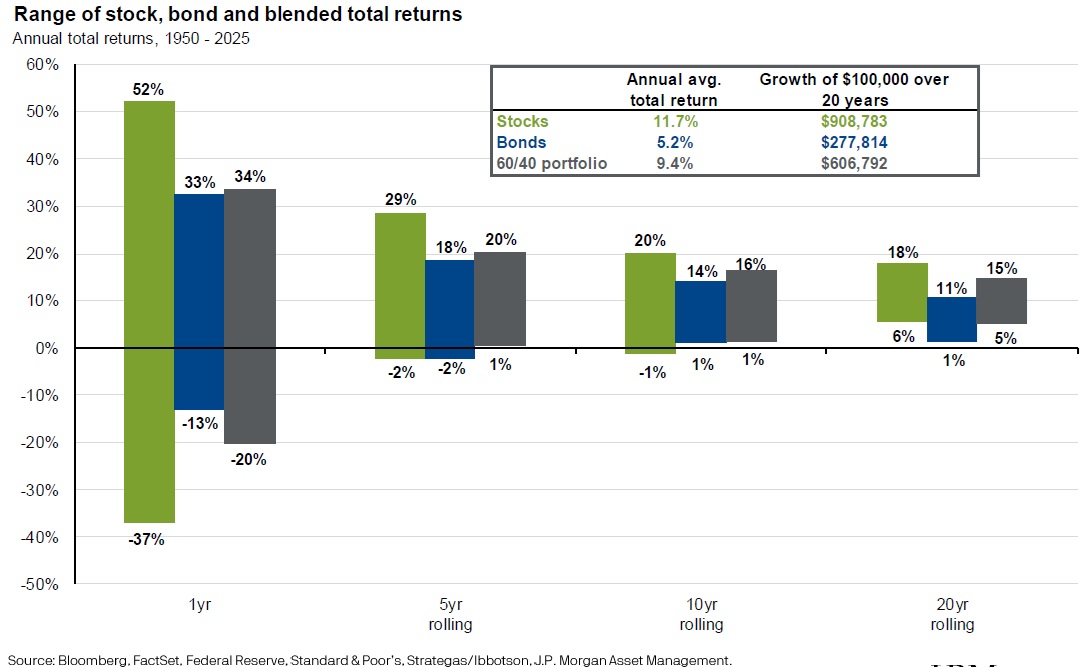
The goal was never to beat the S&P 500. The goal is to fund the life your plan describes. When bonds pay what the plan needs, you do not have to bet that plan on earnings staying spectacular. That is a kind of freedom worth locking in.
Respect gravity. Fund the goal.
Sincerely,
Tony
Unless otherwise noted, market data are as of September 28, 2026, from J.P. Morgan Asset Management, Guide to the Markets U.S., 3Q 2026. Quarter-change figures in the third paragraph run from June 30 to September 30, 2026. Wage and real spending figures are from the Federal Reserve Bank of St. Louis (FRED). Past performance is no guarantee of future results.